_(flipped_left-right).jpg)
The Geek Shed Observatory
Meticulously engineered to observe, image and experiment
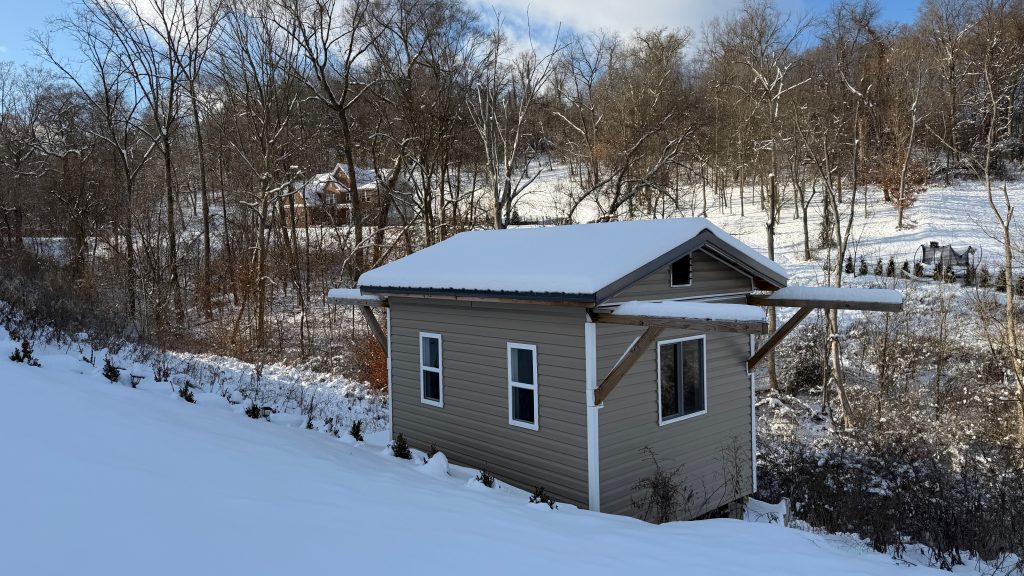
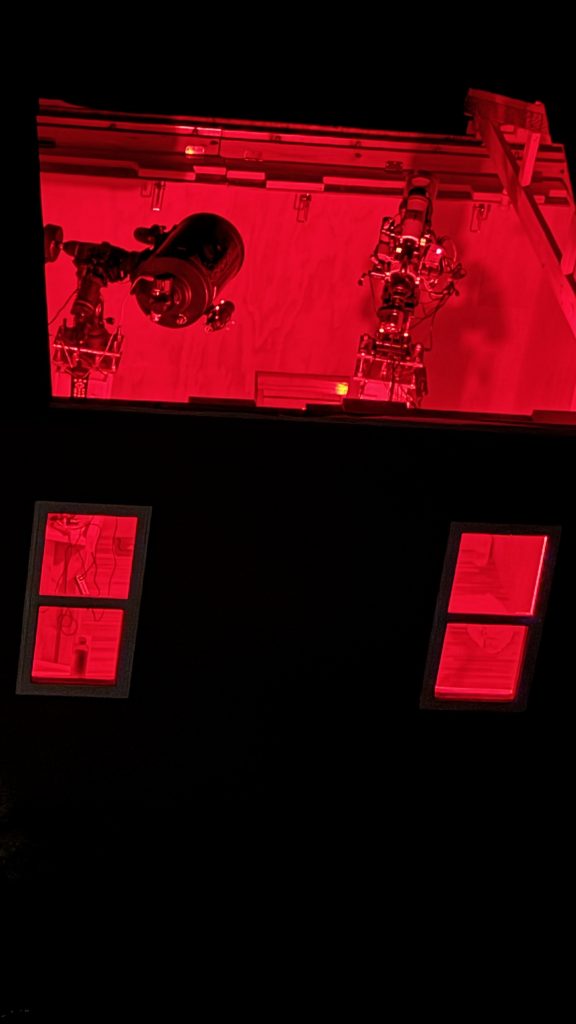
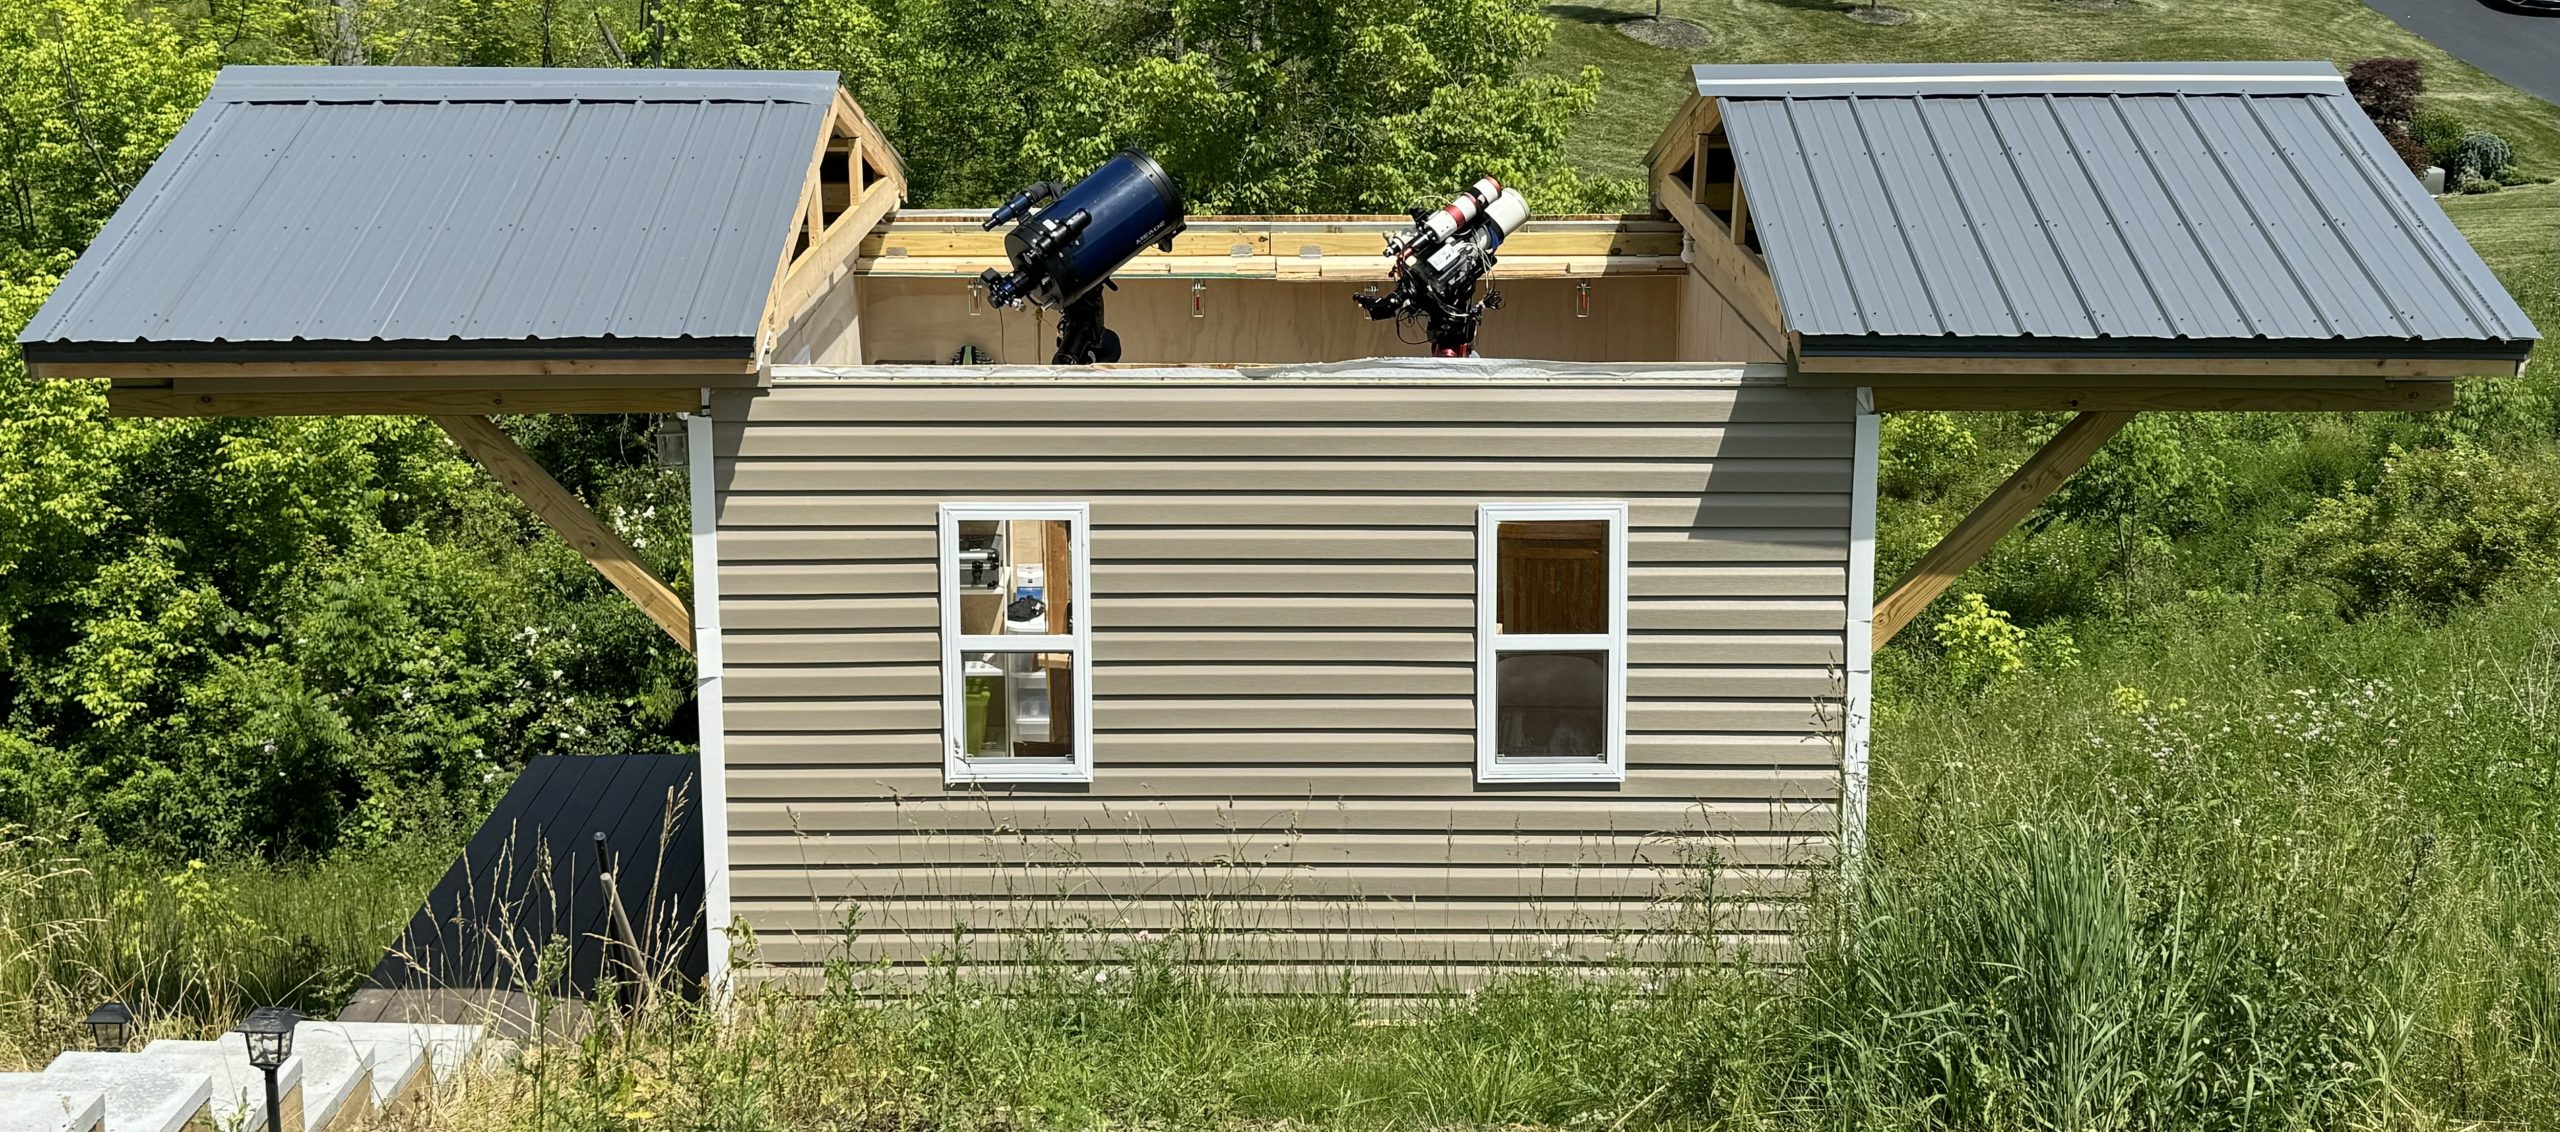
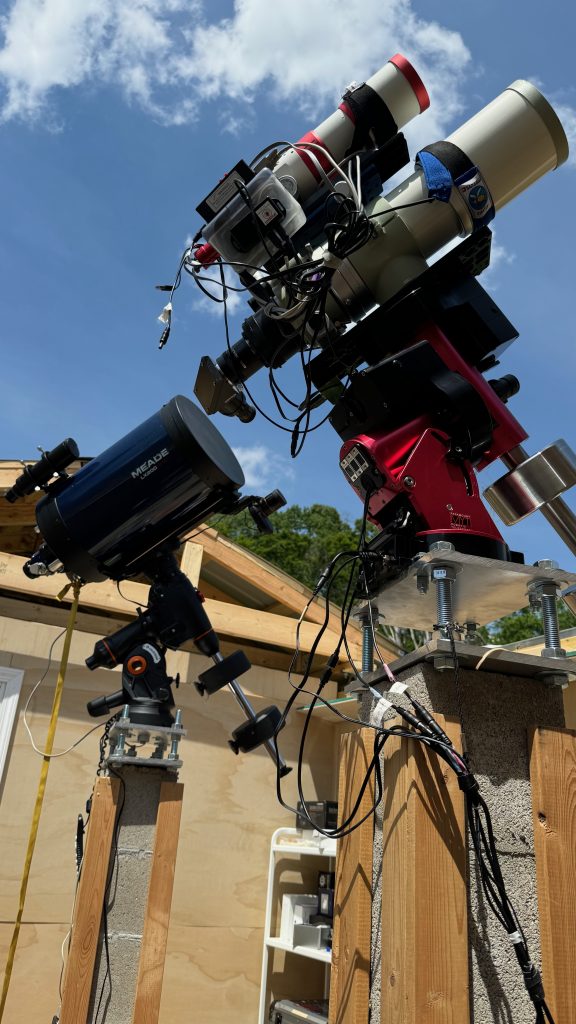

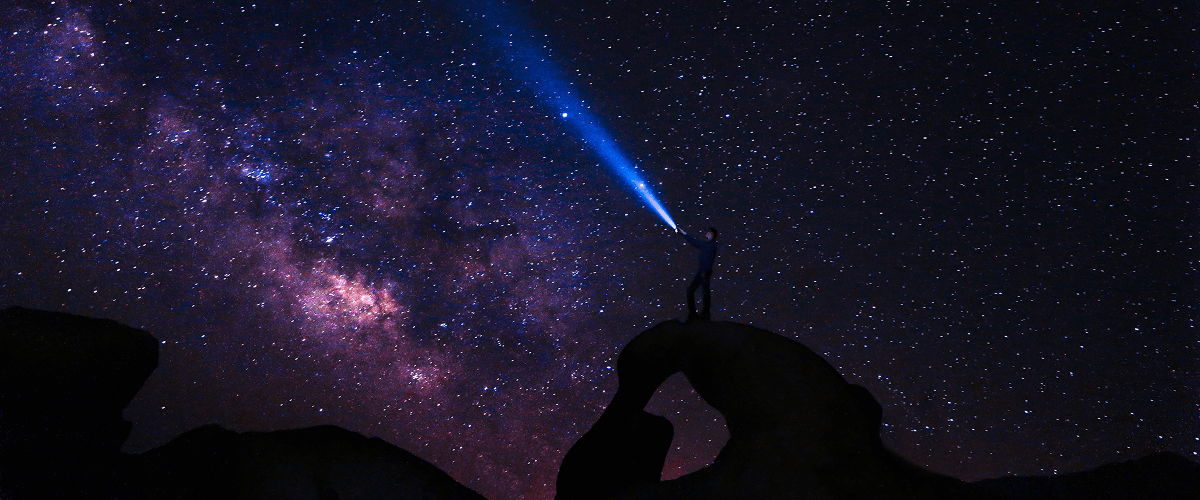
Meticulously engineered to observe, image and experiment
First experience Imaging Andromeda Galaxy
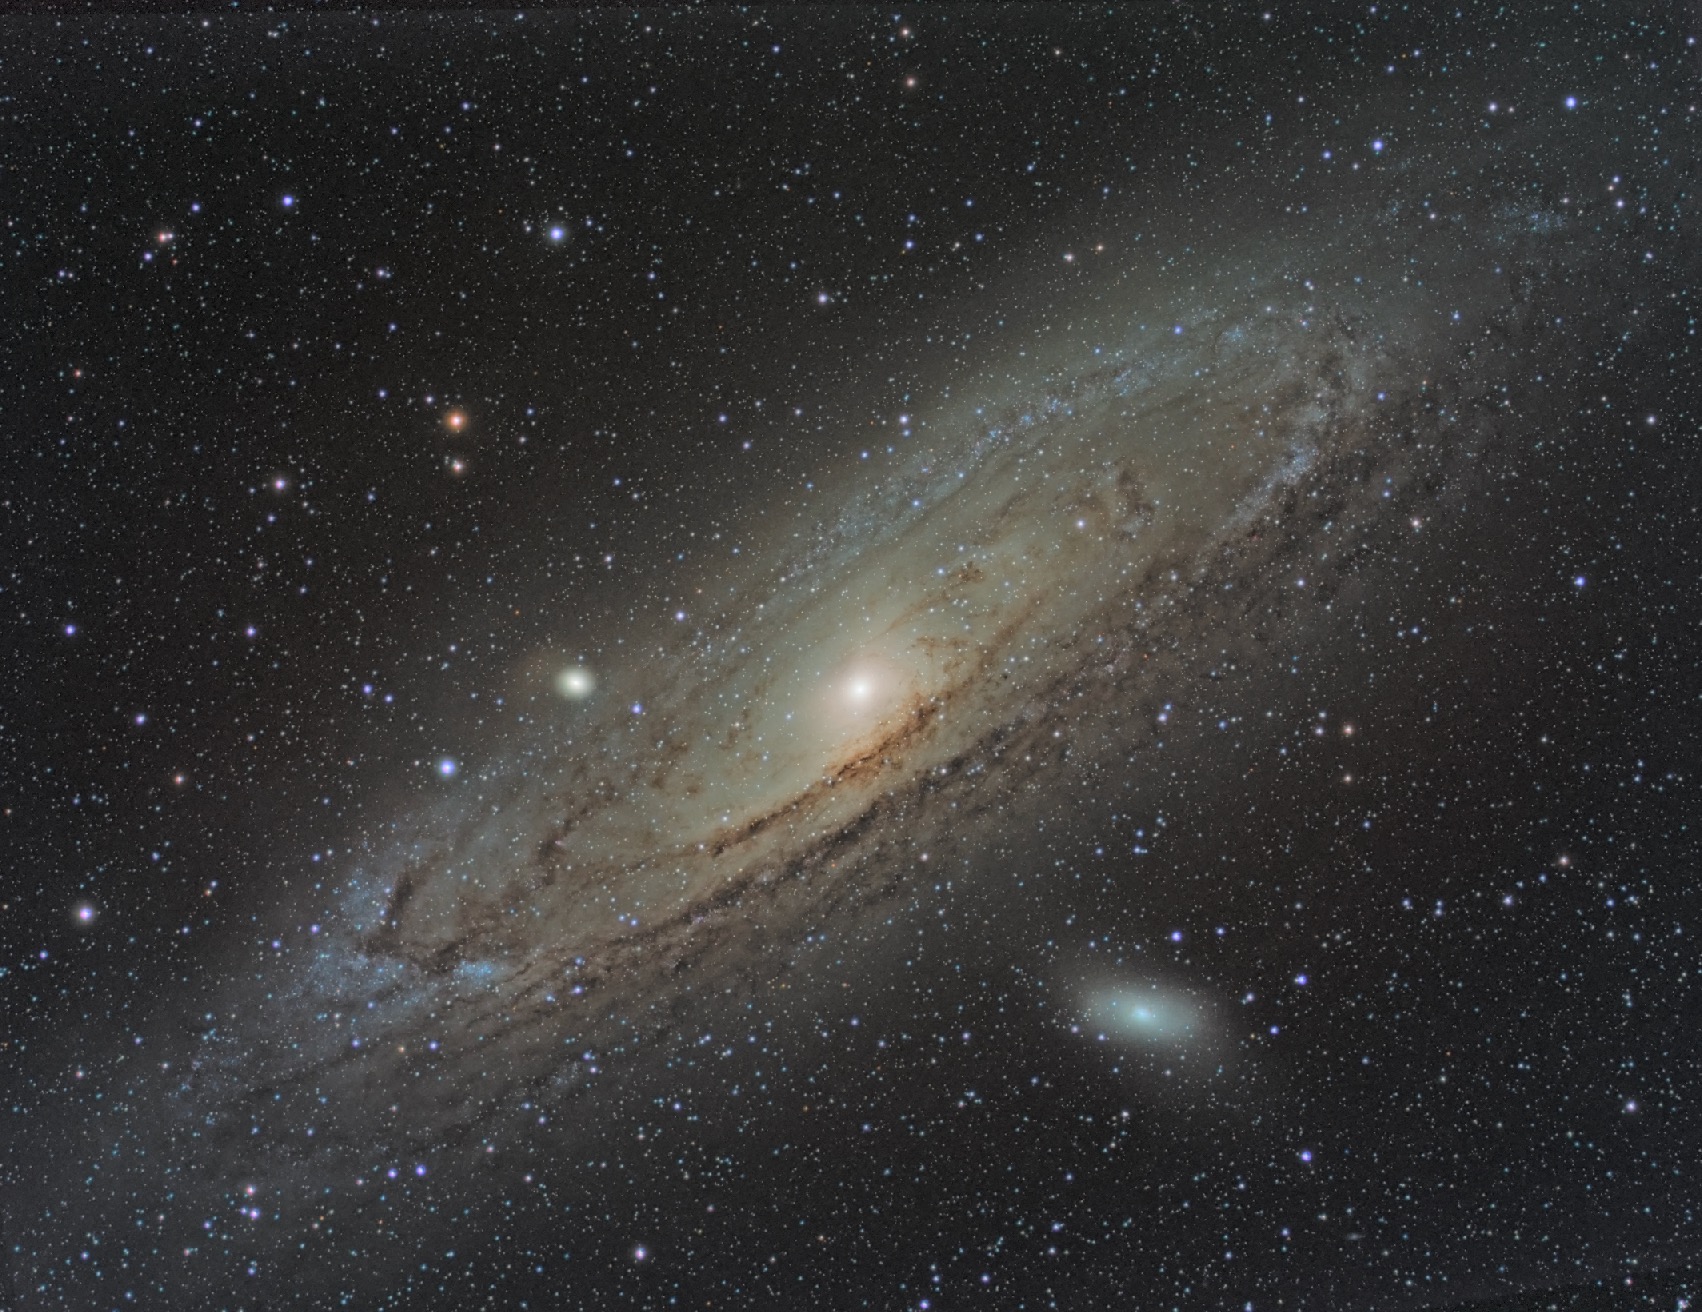
This image of the Andromeda Galaxy began with more than 16 hours of data collection, captured through Hα, OIII, SII, and RGB filters. What followed was over a week of painful calibration, integration, and statistical image processing—slowly drawing structure, dust lanes, and subtle colors hidden within the faint signals
But the numbers only tell part of the story.
These photons recorded by our CCD began their journey more than 2.5 million years ago. They have crossed the vastness of intergalactic space, long before any recorded human history, before civilizations rose and fell—finally arriving at a small backyard observatory on a tiny rock we call home, giving us a direct glimpse into the distant past.
A few hours into that night’s imaging session, the first recognizable details began to appear on the screen. In the stillness of the night, we literally screamed at the beauty of it. This moment remains unforgettable.
M31 in this image is about 2.5 million light-years away, spans roughly 200,000–260,000 light-years, and contain as many as one trillion stars. These numbers can be calculated and stated, but perhaps not truly imagined at a human scale. Do we possess the mental capacity to comprehend such immensity—or can we only rationalize these words and numbers?
Perhaps awe is the most honest response.
Spectroscopy – Low Resolution – Alpy600
Information is everywhere.
It surrounds us, travels across space, and arrives continuously in the form of light. Every photon carries traces of where it came from and what it encountered along the way—but that information remains hidden until we know how to find it.
A telescope gathers the light of a distant object. A spectrograph reveals what that light contains.
By separating light into its individual wavelengths, spectroscopy exposes patterns invisible in an ordinary image. Bright and dark lines emerge, each carrying clues about the source: the elements present, the temperature and density of the gas, the speed and direction of its motion, and the physical processes unfolding within it.
A photon does not arrive with a label describing its history. Its story is encoded in its wavelength, intensity, and interactions with matter. Spectroscopy gives us the tools to decipher that code.
Through spectroscopy, a faint point of light becomes a star with a measurable chemical composition. A distant smudge becomes a galaxy moving through space. A subtle shift in a spectral line reveals gas rushing toward us or racing away. Light that has travelled for millions of years becomes evidence of a physical reality far beyond our reach.
That is the extraordinary power of spectroscopy. It reminds us that information is not absent simply because it is invisible. Often, it is already there—quietly embedded in the light.
We only need to know where to look, how to separate it, and how to listen to what the photons are telling us.
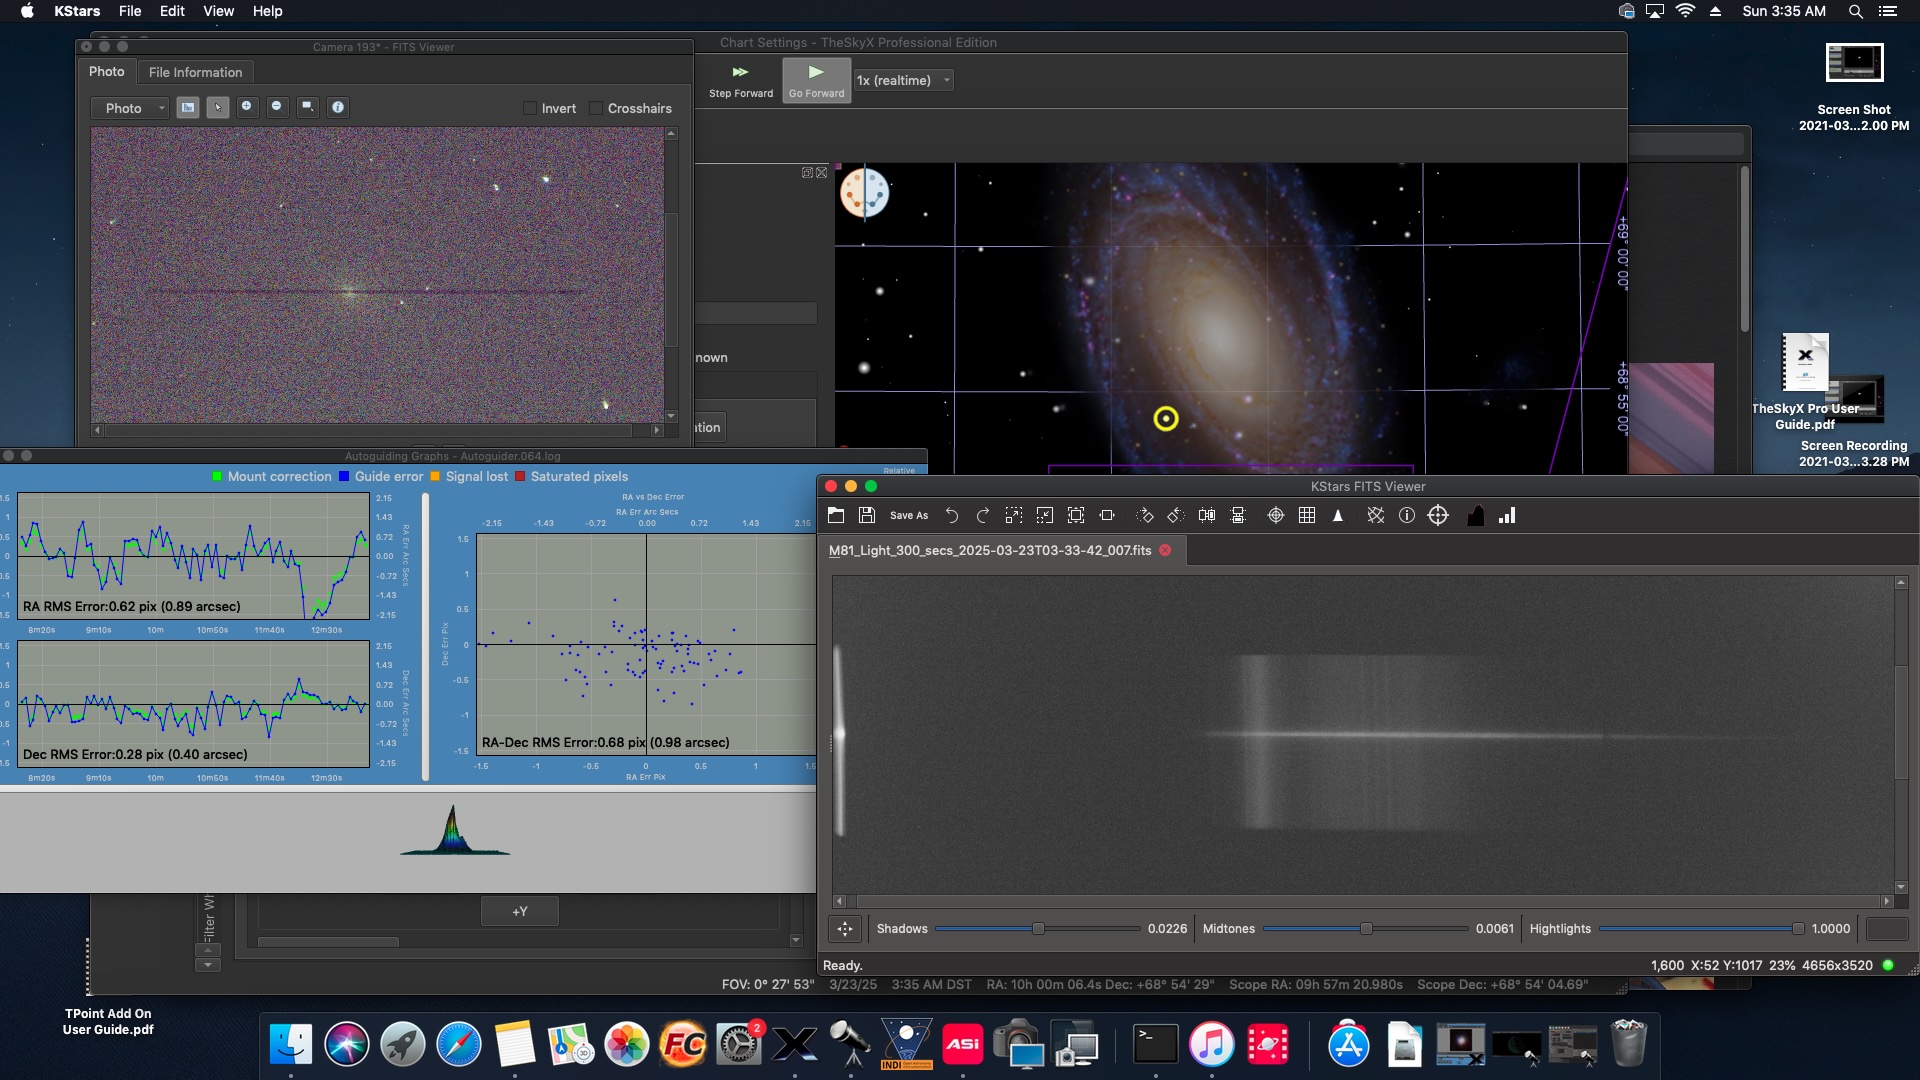
This experiment used low-resolution spectroscopy to compare M82 and M31, with the analysis focused primarily on M82. The goal was to identify spectral features, measure wavelength shifts, and calculate radial velocities, demonstrating that M82 was redshifted while M31 was blueshifted.
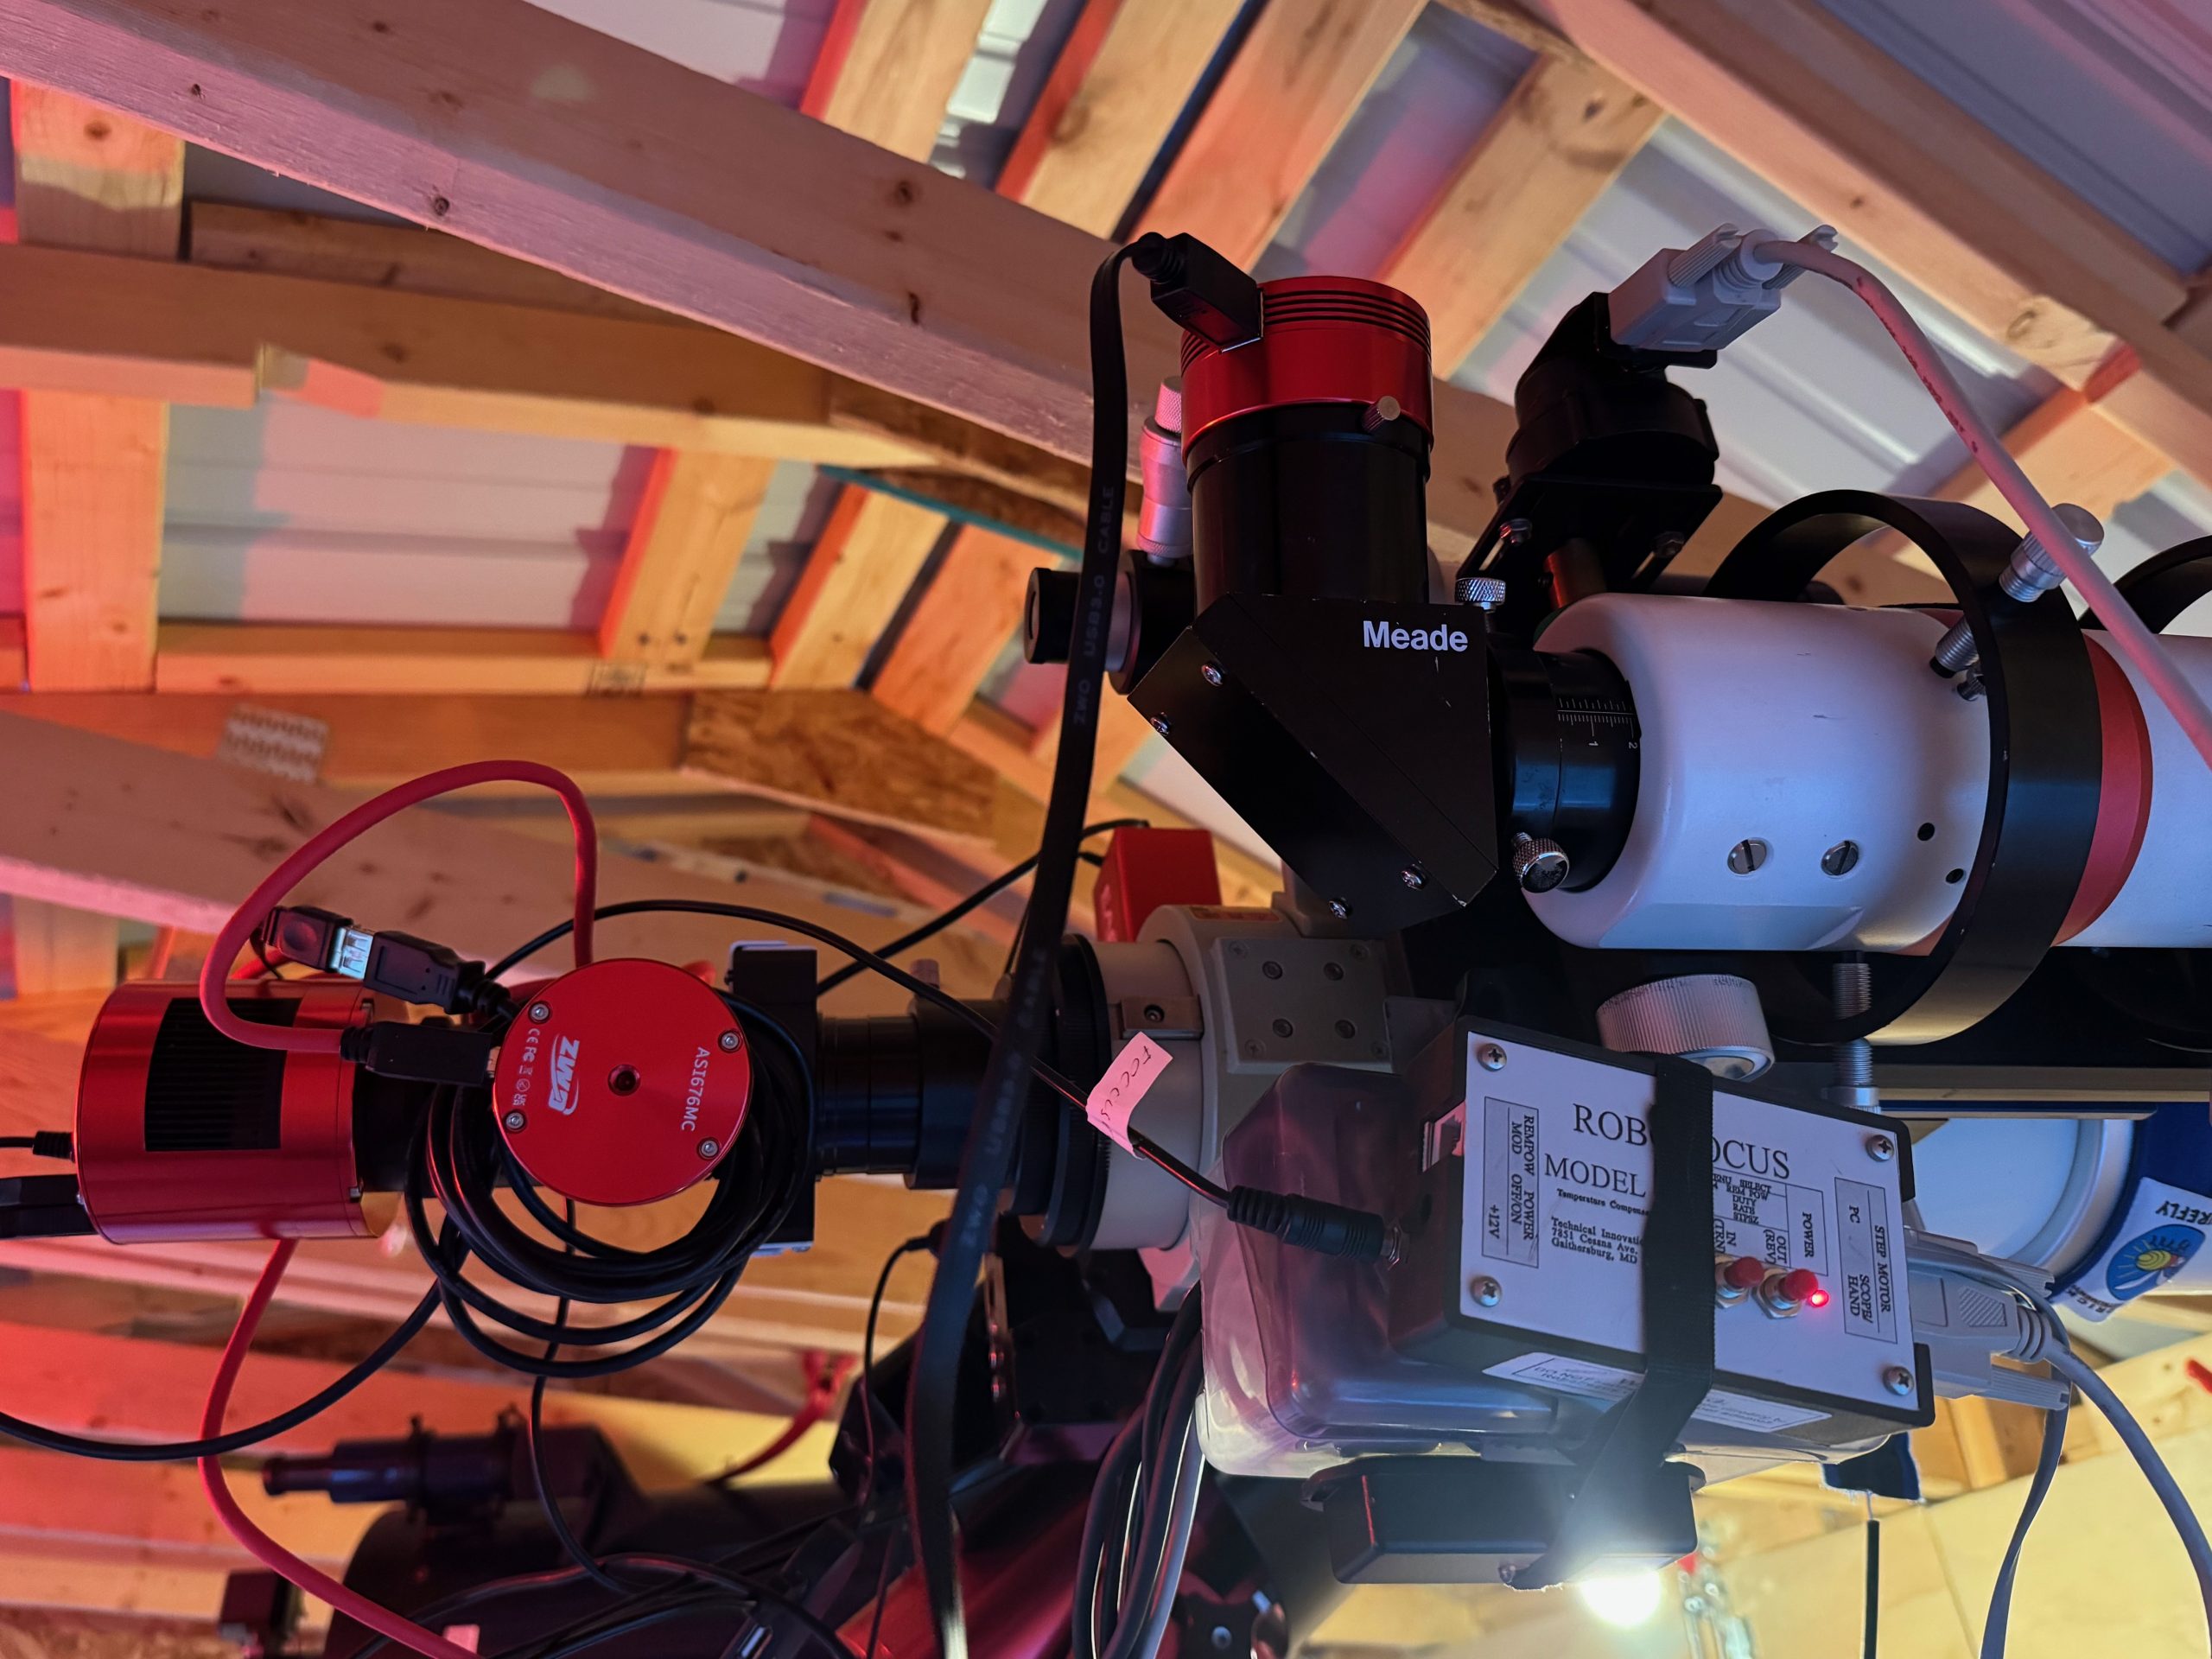
Spectral data were collected from our backyard observatory using a Takahashi FSQ-106 telescope, Shelyak ALPY 600 spectrograph, 23 μm slit, guiding system, cooled cameras, and a Software Bisque Paramount mount. Each light exposure lasted approximately 300 seconds.
The ALPY 600 dispersed the galaxies’ light into its component wavelengths. Dark, flat, and bias frames were used to remove thermal noise, sensor artifacts, and uneven illumination. A Neon-Argon calibration lamp was used to convert pixel positions into accurate wavelengths, while observations of Dubhe were used to correct for atmospheric and instrumental response.
The processed spectrum covered approximately 4000–7000 Å at a resolving power of about R = 584. Prominent features, including Hα, Hβ, [N II], and [S II], were identified using reference wavelengths from the NIST Atomic Spectra Database. These spectral lines provided evidence of the chemical composition, ionized gas, motion, and energetic star-forming activity within M82.
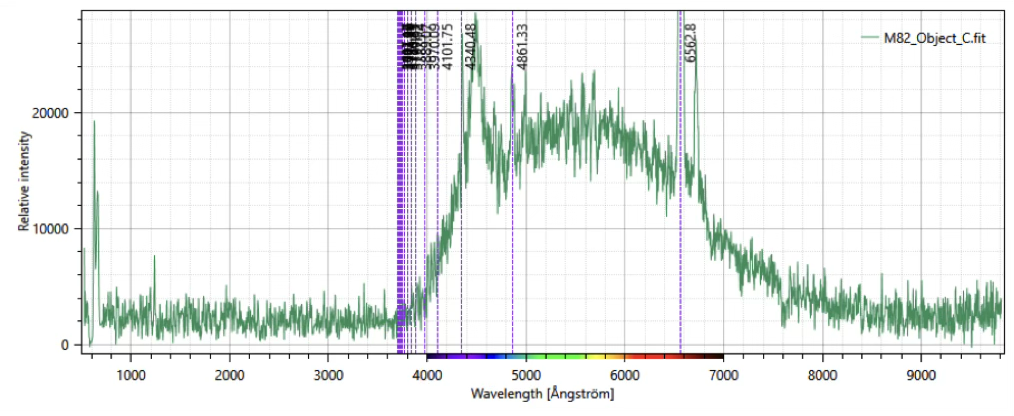
The calibrated spectrum of M82 showed strong emission lines characteristic of a starburst galaxy, including Hα, Hβ, [N II], and [S II]. These features indicated active star formation, ionized hydrogen regions, and low-density gas within and around the galactic core. A distinct sodium doublet was also observed near 5889 Å and 5896 Å.
The measured spectral lines were redshifted by approximately 4–6 Å. Using these wavelength shifts, the radial velocity of M82 was calculated as 232.25 km/s, and its distance was estimated at approximately 10.3 million light-years.
These results were consistent with published professional measurements and fell within the approximate uncertainty of the ALPY 600 system. The experiment demonstrated that amateur astronomical equipment could be used to identify chemical elements, measure redshift, estimate radial velocity, and derive the distance of a galaxy with reasonable accuracy.
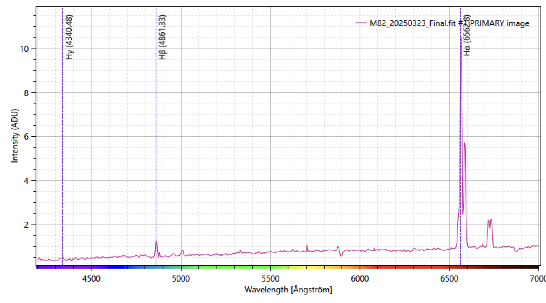
The derived instrument-response data were used to compute the corrected spectrum of M82. The software performed the required calculations and produced an unscaled spectrum containing the available spectral detail. The spectrum was calibrated to a resolving power of approximately R = 584, with an RMS error of 0.023. Although the recorded data extended into the ultraviolet and infrared regions, wavelengths below 4000 Å and above 7000 Å were not included in the calibration or analysis.
The corrected spectrum was then normalized, scaled, and cropped for further analysis and calculation. The calibrated spectrum clearly identified the Balmer lines, including Hα, Hβ, and Hγ. The analysis focused primarily on Hα, Hβ, [N II], and [S II]. The measured wavelengths of these features were compared with their theoretical values, and the NIST Atomic Spectra Database was used to identify the chemical elements present in the spectrum.
About us

High School Junior, budding astronomer

Maker, Tinkerer and Engineer
our blog
Our adventure in the planning, design, considerations and construction of the GeekShed Observatory Welcome to The Geek Shed Observatory (your feedback on my site is…
This new website will be primarily used to highlight all the capabilities that exist in the observatory. Discuss various instrumentations, techniques, outcomes of observation sessions.